
Federal Reserve Chairwoman Janet Yellen weighed in on the prospects of an equity bubble at a meeting with International Monetary Fund Director Christine Lagarde earlier this month. The danger warnings beat to the drums of Mark Cuban’s worse than 2000 prediction because the tech sector was singled out as the asset class with overinflated valuation.
A quick glance at the NASDAQ Composite Index’s breach of the infamous 5000 would seem to support these claims. For those who remember Y2K, it was an era that put the Great Gatsby to shame. It has been 15 years since the dot-com crash. Should we be worried about a sequel?
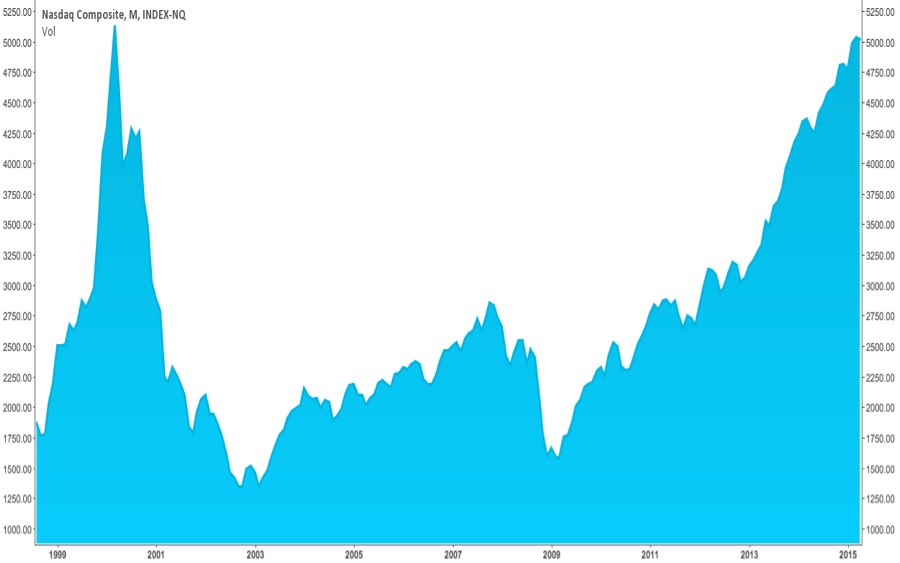
The NASDAQ Composite Index breaches 5000 in 2015, the first time since 2000.
A bubble is like #TaylorSwift – a nightmare dress like a daydream.
The classic definition of a bubble is rapid, increase in asset prices that is followed by a collapse in prices arising from speculation or enthusiasm rather than intrinsic increases in value. In other words, it’s a blank space that will leave you breathlessand with a nasty scar.
Key Performance Indicators
The NASDAQ is the barometer for the tech sector because of its large portfolio of technology companies, collectively valued at over $9.1 trillion (2015). The argument for the existence of bubbles is often based on absolute volume, valuations and base points.
However, these figures are not indicative of a bubble because these do not measure speculation. It’s like saying we are driving 100 mph and, therefore, the engine is overheating. It’s fast, but not necessarily hot.
Look closer and you will see significant and measureable differences between 2015 and 2000:
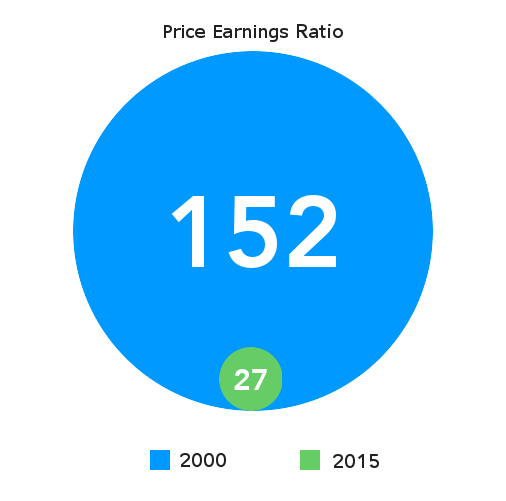
A high PE Ratio could indicate overvaluation, meaning the share price is expensive relative to the overall market. During the dot-com boom, investors were willing to pay a 152x premium on stocks. In 2015, PE ratio is much closer to the industry average of 19.1.
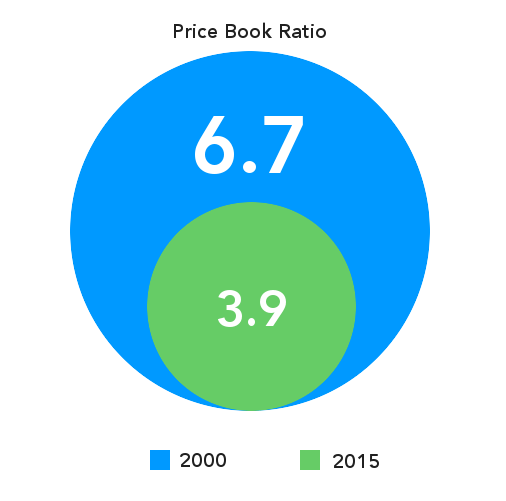
The PB Ratio measures the current market price with the book value of equity or the book value of assets less liabilities. A large deviation between stock prices and book value may reflect assets that are over valuated.
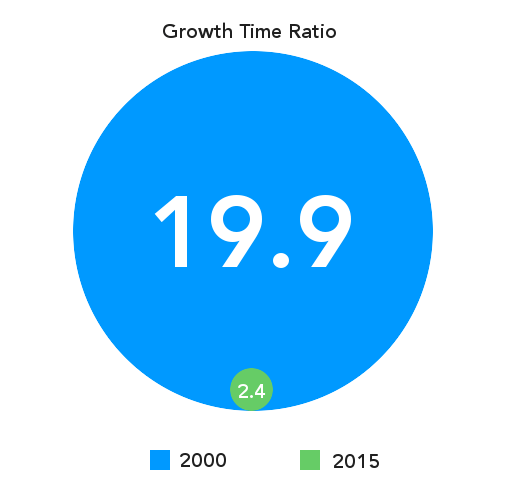
The GT Ratio measures the performance of an asset, calculated by the aggregate growth rate (%) divided by months. Suppose a leading indicator of a bubble is an asset that grows more than 3x in 5 years (PT = 5.0); a GT ratio > 5 is a signal of a bubble. Keep in mind, early stage tech investors expect returns higher than 3x in 5 years.
Diversified Portfolio
Diversification reduces risk. In 2000, the NASDAQ had 64.9 percent of its components in the technology sector. While in 2015, only 43.3 percent is from the tech sector. This reduces exposure to inherent volatility of technology.

Composition of NASDAQ Industries in 2000 & 2015. Blue bars denote industries with decreasing market weight; green bars denote industries with increasing market weight (click to enlarge). (Source: NASDAQ)
Intrinsic Value
Fifteen years ago, it was not uncommon for investors to cut checks based on a slick pitch deck and watch it burn on a Super Bowl commercial. Today, technology investors are savvier, organized and better equipped. More often than not, investors are demanding paying (i.e. traction) and returning (i.e. stickiness) customers because the voting dollar represents customers who are willing to pay for a good/service. This intrinsic value was not prevalent during the dot-com bubble.
Trending
Comparing the trend lines of the NASDAQ, Dow Jones, S&P 500, and the NYSE, it is clear that the NASDAQ was in a bubble that burst at the turn of the millennium:
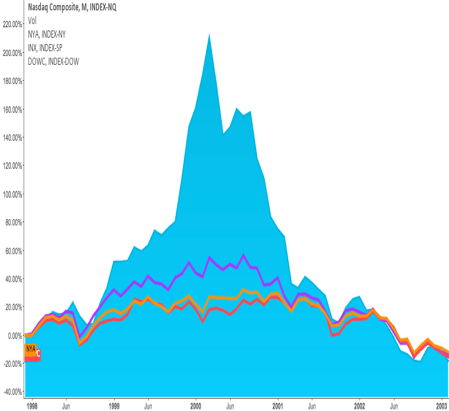
In 2000, the NASDAQ outpaced major markets in the US but quickly succumbed to gravity within 17 months.
Contrasting with the years preceding 2015 in the same time scale, there is a uniform trend with the other stock markets, reflecting growth in all sectors:
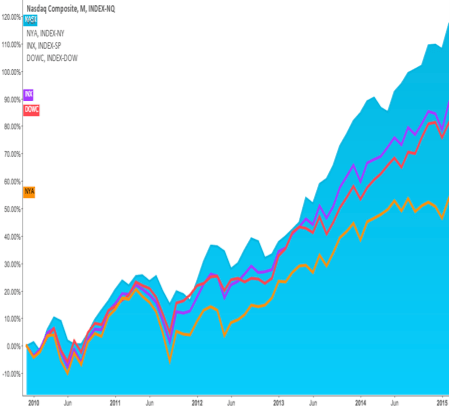
In 2015, the NASDAQ is on par with major markets in the US, which have been bullish for several quarters.
Bubble, Bubble, Toil and Trouble
Markets are irrational and corrections can and do occur. If a bubble were to form, it would likely occur in the biotech sector because it has experienced a rapid a growth rate of 500 percent in four years (GT=10.4) combined with a PE ratio of 40. This sector was also singled out in the Federal Reserve’s Monetary Report. However, the damage of a biotech correction is somewhat limited to the 11.2 percent ballast on the NASDAQ.
To Infinity and Beyond?
The current (2015) bull market is not indicative of a tech bubble, but the U.S. economy is unlikely to sustain growth at the same rate because of exogenous and endogenous reasons:
- Business Cycles: Natural cyclical oscillations occur on average every 58.4 months.
- Global: Eurozone’s economy remains unstable and China’s GDP has been contracting steadily.
- Currency: The strong U.S. dollar is widening current account deficit and increasing currency translation costs for U.S. multinationals. McDonald’s lost over a half billion dollars in currency translation last year. That is a lot of (un)happy meals.
- Interest Rates: The Federal Reserve is expected to raise interest rates by around 0.25 percent, which would cool the U.S. economy.
Given these factors, the NASDAQ Composite Index is likely to experience diminishing marginal returns with a lower growth rate of 4-7 percent for 2015 (down from14.75 percent in 2014). Note: shelf life of this article is best before January 1, 2016.


