Learning Signal and System Using Matlab (Part _1)
Question # 1
Consider the following equation:
a) Write a MATLAB M-file function to obtain numerical values of y(t). Your function must take y (0 ),theta, eita , t and as function inputs and y (t ) as output argument.
b) Obtain the plot for y(t) for 0<t<10 with an increment of 0.1, by considering the following two cases
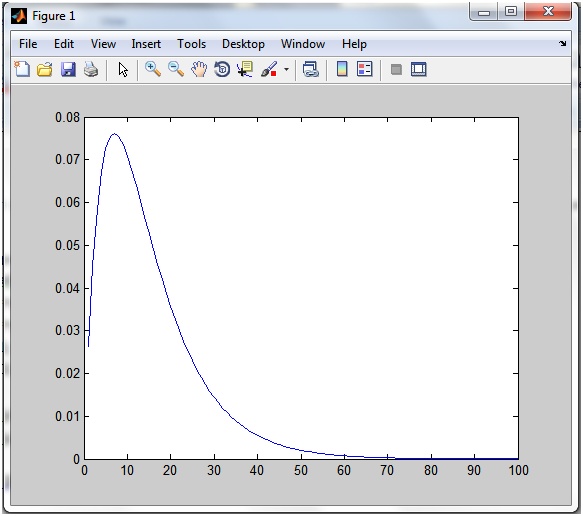
Case 1: y( 0)=0.15 m, w= sqrt(2) rad/sec, eita= 3/2sqrt(2) and theta= 0 ;
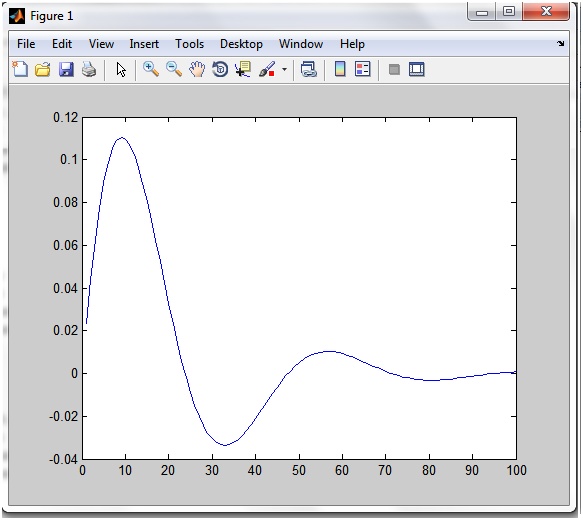
Case 2: y( 0)=0.15 m, w= sqrt(2) rad/sec, eita= 1/2sqrt(2) and theta= 0 ;
Solution:
Open the matlab function file and write the following code Save it with the “sinfunc” name
function y = sinfunc( y_1, eita, w, t, theta)
y=(y_1/(sqrt(1-eita))) * (exp(-1*eita*w*t))*sin((w*sqrt(1-(eita*eita))*t)+theta);
end
a=1; t=0.1;
while(t<10)
y1(a)=sinfunc(0.15,3/(2*sqrt(2)),sqrt(2),t,0);
y2(a)=sinfunc(0.15,1/(2*sqrt(2)),sqrt(2),t,0);
a=a+1;
t=t+0.1;
end
plot(y1);
plot(y2);
Out Put :


Question # 2
Use ‘for’ or ‘while’ loop to convert degrees Fahrenheit (Tf) to degrees Celsius using the following equation . Use any starting temperature, increment and ending temperature
Solution:
Open the function file from matlab and write the following code and save it with “ctf”.
function f = ctf( c ); %function decleration
f = ((9/5)*c)+32;
t=0;
while(t<200)
Tf(i)=ctf(t);
i=i+1;
t=t+10;
end
Tf
Tf =
Columns 1 through 15
32 50 68 86 104 122 140 158 176 194 212 230 248 266 284
Columns 16 through 20
302 320 338 356 37
Question # 3
Plot the function
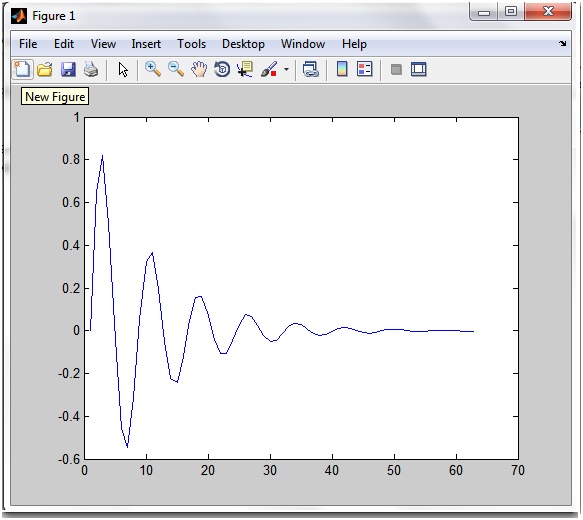
Y(x)=exp(-x)sin(8x) for 0<=x<=2π
Solution:
Open the function file and type the following command in the function file and save it with “ func”.
function y = func(x) % function decleration
y=exp(-x)*sin(8*x);
command window .
i=1;
x=0;
while(x<=(2*pi))
y(i)=func(x);
i=i+1;
x=x+0.1;
end
plot(y)


