LEARNING SIGNAL AND SYSTEM USING MATLAB (PART _2)

Question : 01
Give two examples of Odd and Even signals each and plot them in MATLAB.
Solution:
Example of even signals:
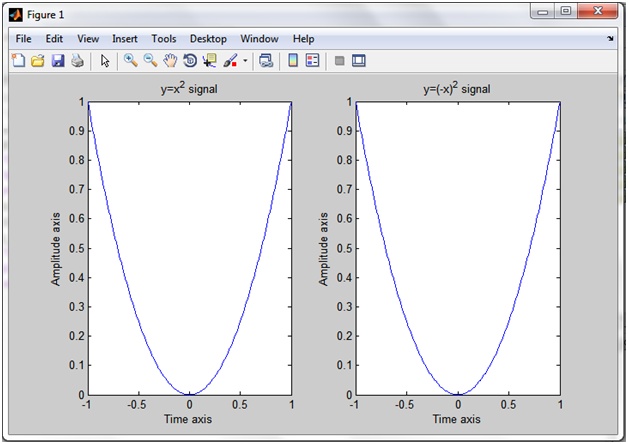
1) y=x^2 is a even signal
Write the following command in the matlab command window.
t=-1:0.01:1;
y_1=(t.^2);
subplot(1,2,1);
plot(t,y);
xlabel('Time axis');
ylabel('Amplitude axis');
title('y=x^2 signal')
As we know if a signal is even the it is symmetric about origion i.e x(t)=x(-t)
y_2=((-t).^2);
subplot(1,2,2)
plot(t,y_2)
xlabel('Time axis');
ylabel('Amplitude axis');
title('y=(-x)^2 signal')
Out put are shown in figure given below.
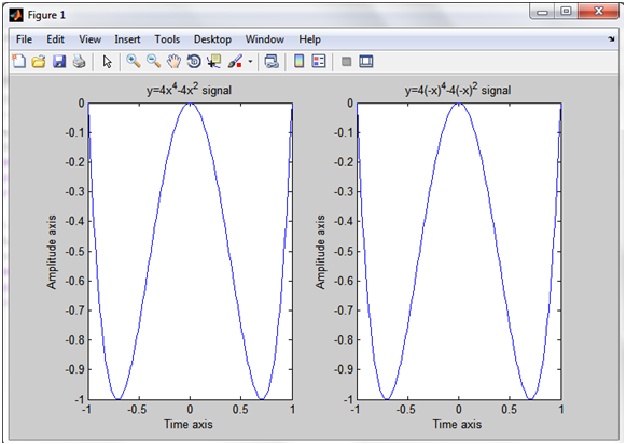
2) Next example of even signal is y=(4*t.^4-4*t.^2)
Write the following command in matlab.
>> t=-1:0.01:1;
y_1=(4*t.^4-4*t.^2);
subplot(1,2,1);
plot(t,y_1);
xlabel('Time axis');
ylabel('Amplitude axis');
title('y=4x^4-4x^2 signal')
As function is even so it is symmetric about origion Ii.e x(t)=x(-t)
y_2=(4*(-t).^4-4*(-t).^2);
subplot(1,2,2);
plot(t,y_2);
xlabel('Time axis');
ylabel('Amplitude axis');
title('y=4(-x)^4-4(-x)^2 signal')
output is shown below:
Examples of Odd signals:
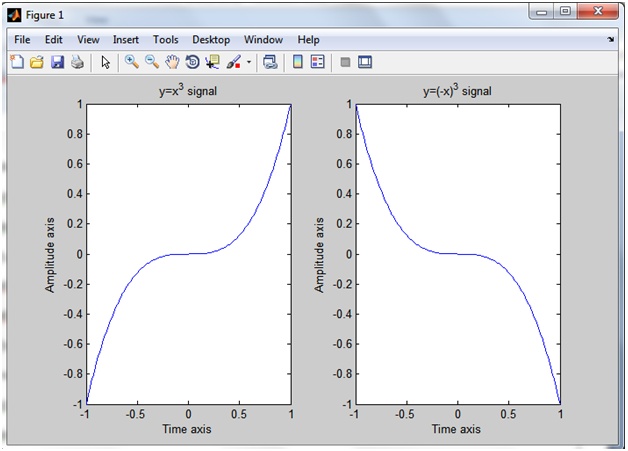
1) y=x^3 is a odd signal
t=-1:0.01:1;
y_1=(t.^3);
subplot(1,2,1);
plot(t,y_1);
xlabel('Time axis');
ylabel('Amplitude axis');
title('y=x^3 signal')
Now signal is odd so x(t) is not equal to x(-t).
y_2=((-t).^3);
subplot(1,2,2);
plot(t,y_2);
xlabel('Time axis');
ylabel('Amplitude axis');
title('y=(-x)^3 signal')
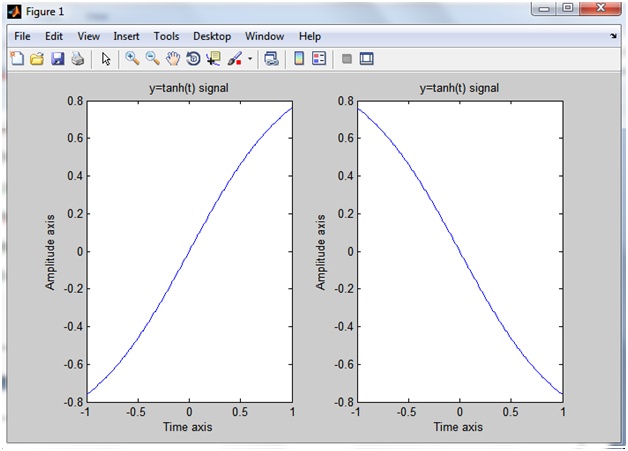
2) y=tanh(x) is odd signal
>> t=-1:0.01:1;
y_1=tanh(t);
subplot(1,2,1);
plot(t,y_1);
xlabel('Time axis');
ylabel('Amplitude axis');
title('y=tanh(t) signal')
Now signal is odd so x(t) is not equal to x(-t).
y_2=tanh(t);
subplot(1,2,2);
plot(t,y_2);
xlabel('Time axis');
ylabel('Amplitude axis');
title('y=tanh(-t) signal')
Question # 2
Periodic and Aperiodic Signals
Is the given signal periodic or Aperiodic?
Plot the signal in MATLAB to verify your answer.
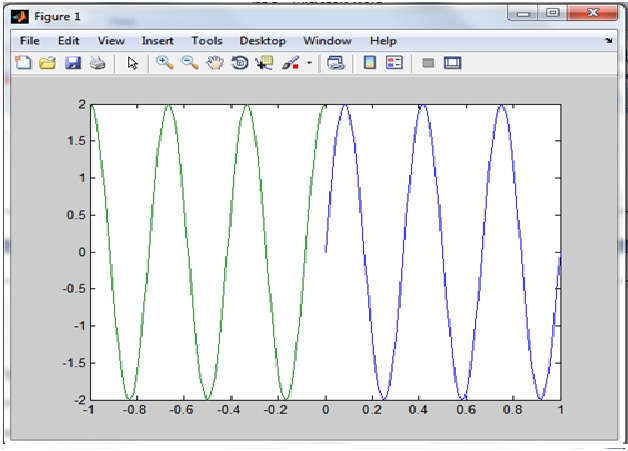
Solution: Write the following code in matlab command window.
t=0:0.01:1;
a=2;
f=3;
y=a*sin(2*pi*f*t);
time=-1:0.01:0;
y_1=a*cos(2*pi*f*t);
plot(t,y,time,y_1)
As we know that signal is periodic if its repeats itself after an appropriate amount of shift.But this signal is not repeating itself after shifing any amount of time.
Output:
Question # 3
Classification of Signals
Are y(t) and z(t) Energy signals or Power signals? Give reasons for your answer using the results in last question.
Solution :
Y(t) is neither a energy nor a power signal because both are inf.
Z(t) is a power signal because it have finite power i.e 0.5